What you'll Learn
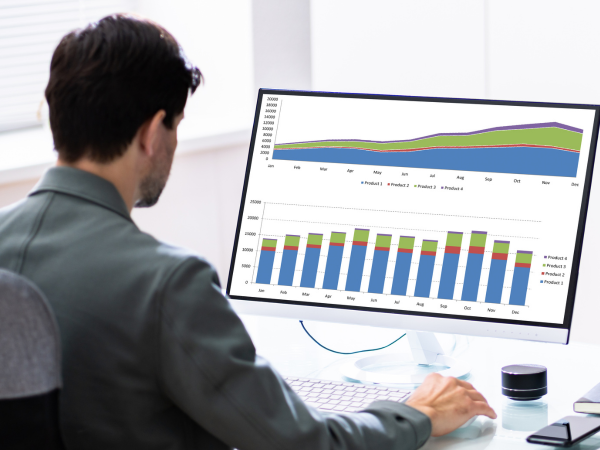
Explore data manipulation, basic statistical analysis, and dashboard creation in Excel.
Learn to create advanced visualizations and interactive dashboards in Power BI and Tableau.
Master SQL for database querying, manipulation, and management.
Understand the basics of Figma and its application in enhancing data visualizations created in Power BI and Tableau.
Understand the basics of Figma and its application in enhancing data visualizations created in Power BI and Tableau.
- Engage in a comprehensive project where you can choose to work with Power BI or Tableau, integrated with Figma, to design business dashboards/reports.
- This project will contribute to your professional portfolio, showcasing your data analysis and visualization skills.


